Enrolling in Medicaid in Missouri: Challenges, Considerations and Comparisons over Time
As Missouri has faced the unwinding of the public health emergency, and the expansion of Medicaid, enrolling recipients become challenging at times
May 2024 — The past 30 months has brought challenges for the recipients seeking to enroll in Missouri’s Medicaid program, and the state of Missouri working to process these applications. This article describes some of those challenges. The challenges have occurred during a period when Missouri has been implementing the expansion of Medicaid, while also dealing with the unwinding of the public health emergency (PHE). Challenges with processing the applications has led at times to significant delays in processing applications. The source for this analysis done by analysts from the Center for Advancing Health Services, Policy and Economics Research using mostly data from the State of Missouri, Monthly Management Reports.
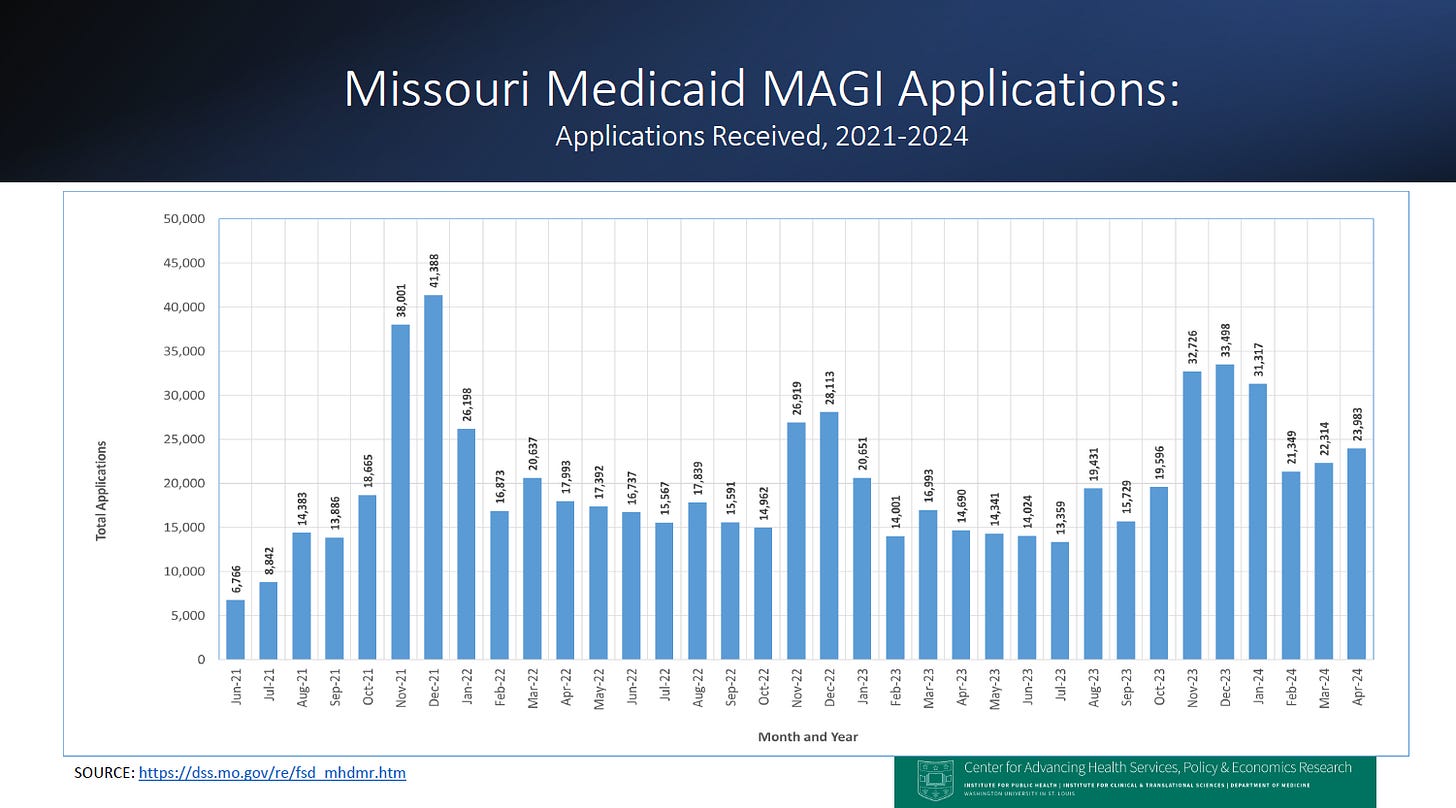
Number of MAGI Applications. In April 2024 the number of MAGI (Modifed Adjusted Gross Income) applications reached 23,983, an increase over the level in March (see graph). Although the number of MAGI applications was much higher during the Obamacare open enrollment period (see graph), as it was in previous years, the average number of applications received in the last three months (22,549) has been significantly higher than the number received in previous months over the 2021-24 period since Medicaid began (average, 16,500) (excluding open enrollment months, November, December, January). It is difficult to determine why there has been an increase in number of applications in recent months, but it is possible it is because some people who lost Medicaid previously are applying for Medicaid coverage again (churning), or switiching to another category of Medicaid once they lose Medicaid during the unwinding (e.g. switching into the Adult Expansion Group).
Pending applications. The number of pending MAGI applications increased slightly to 17,884 in April 2024, though significantly below the pending number of almost 53,000 pending applications in January 2024 (see graph). The significant increase in pending applications led to significant delays in processions applications for Missourians seeking Medicaid, rising from a reported average of 10 days in April 2023 to a reported average of 57 days in February 2024, though the average of pending days dropped to 33 days in April 2024 (see graph).
Note that processions delays were very significant in early 2022, before Missouri enacted a mitigation plan, then the average number of days to process applications dropped significantly.
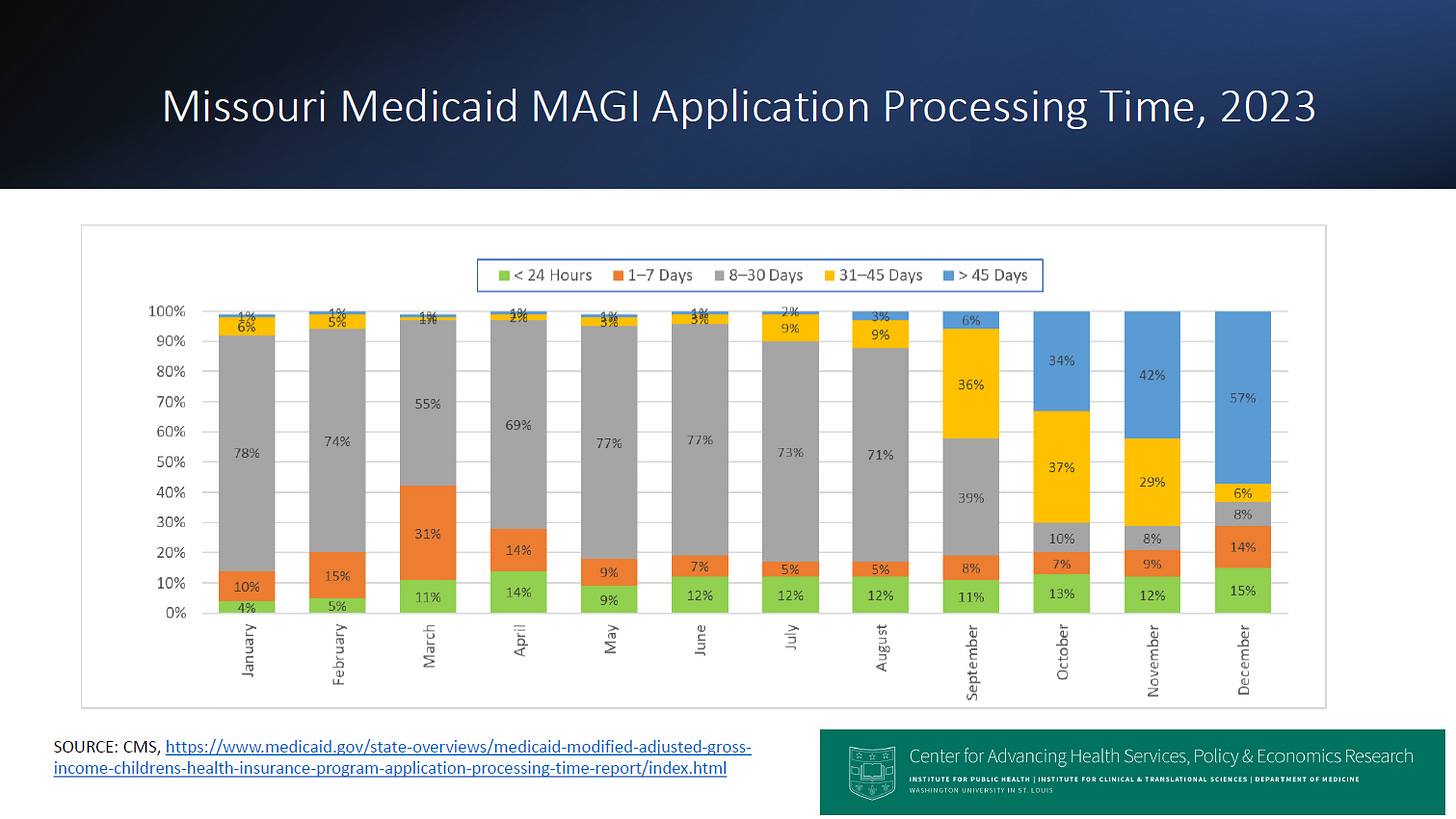
Breakdowns of processing times and national comparisons. Although the state of Missouri provides the average days to process applications, the state no longer provides breakdowns of processing times into categories (that is, the application is processed in less than 24 hours, 1-7 days, 8-30 days, 31-45 days, or 45 or more days) in its monthly reports. However, the state is required to report these breakdowns to the federal government, Centers for Medicare and Medicaid Services. Processing times are available through December 2023 in Missouri and the U.S. and in other states. The next two graphs show these processing times, from data reported to CMS. As shown, late in 2023 the proportion of applications processed in 45 days or more was high (for example, 57% in December). It is worth noting that by federal law, the states are required to process applications in 45 days or less. Note that prior to October it was typical for most applications to be processed in 8-30 days in Missouri.
In comparison, across the U.S., the pattern looks quite different. Over half of the Medicaid applications were processed within 24 hours in 2023 nationwide.
__________
Report prepared by analysts at Center for Advancing Health Services Policy and Economics Research (CAHSPER), Institute for Public Health (IPH), Washington University in St. Louis.


